To further those efforts, the data team has worked on propensity-to-buy, next-best-action and churn models to lower manual labour and incorporate data insights into their customer acquisition and retention journey.
This has helped them increase retention by over 14 percent in just three months, with the current subscriber count at 1.8 million across the Mediahuis group.
Mediahuis started its data journey six years ago and today has 40 people in the data team.
The publishing group owns more than 30 news brands in Belgium, the Netherlands, Ireland, Luxembourg and Germany.
Jessica Bulthé, Data Science Business Partner, joined WAN-IFRA’s recent Digital Media Europe Conference in Vienna to talk about Mediahuis’ data-driven work in the past few years to achieve a more personalised customer journey experience.
Advantages and drawbacks of A/B testing
A/B testing plays a crucial role in understanding the best strategy to get anonymous users to register, converting them and hopefully retaining them, and that’s something Mediahuis has been doing for years, like other publishers.
However, continuous A/B testing requires a lot of manual effort. The more complex the subscription economy becomes with more possibilities for technology coming up, the more manual labour it requires, Bulthé said.
“You’re pulling in from different tools, you’re learning from different places and suddenly it’s chaos,” she said. “It’s also a slow process. Running 20 A/B tests simultaneously is not efficient, because you won’t be able to identify what worked in that case.”
For example, a publisher can conduct an A/B test where the B test performs better for 70 percent of its users, compared to the A test. So, there is a clear winner.
However, “the winner takes all” outlook can be problematic, Bulthé said. If the publisher uses the results of the B test for its users, it is disregarding the 30 percent for whom the A test performed better.
This played directly into the brand’s existing challenge of trying to reach younger audiences. However, most of Mediahuis’ subscribers are older people.
“Going with the results of Test B would have left no room for personalisation and differentiation. We would have been pushing our optimisations even more towards the bigger portion of our audiences,” she said.

Anticipating actions with help from propensity modelling
The next idea to explore was propensity modelling, which encompasses techniques for constructing predictive models that anticipate the probability of prospects to buy a subscription based on their past behaviours.
Bulthé broke down the process of creating a predictive model:
- Collecting data (first-party and behavioural data)
- Cleaning that data
- Identifying patterns
- Making predictions
“Machine learning models are great at identifying past trends from data sets, learning them and predicting new behaviour patterns for new users,” she said. “This helps us in splitting that huge pool of users into different subgroups – People who are very likely to buy, people who might buy, and people who are lost causes.”
A data-trained propensity model still requires manual effort, this time concentrated on differentiating between different audiences.
“This might again increase chaos in all the different things you’re doing,” she said.
The key here, according to Bulthé, is to not have a predictive model, but one that can automate daily tasks and improve the customer journey in a personalised manner.
“If the trained model still requires you to do a lot of manual work and A/B testing and use that data to make decisions, then you’re working data informed,” Bulthé said.
The solution that worked for Mediahuis was to move away from a data-informed way of working to a truly data-driven way, where the testing is left to the algorithm.
Making use of past customer journeys
The team has now started experimenting with next-best-action modelling.
It involves the same initial steps of collecting and cleaning data. However, in this model, users are linked to the campaigns they have seen and/or interacted with.
This model learns from past customer journeys and predicts actions to undertake to optimise the customer lifetime value of micro-audiences based on several possible variables.
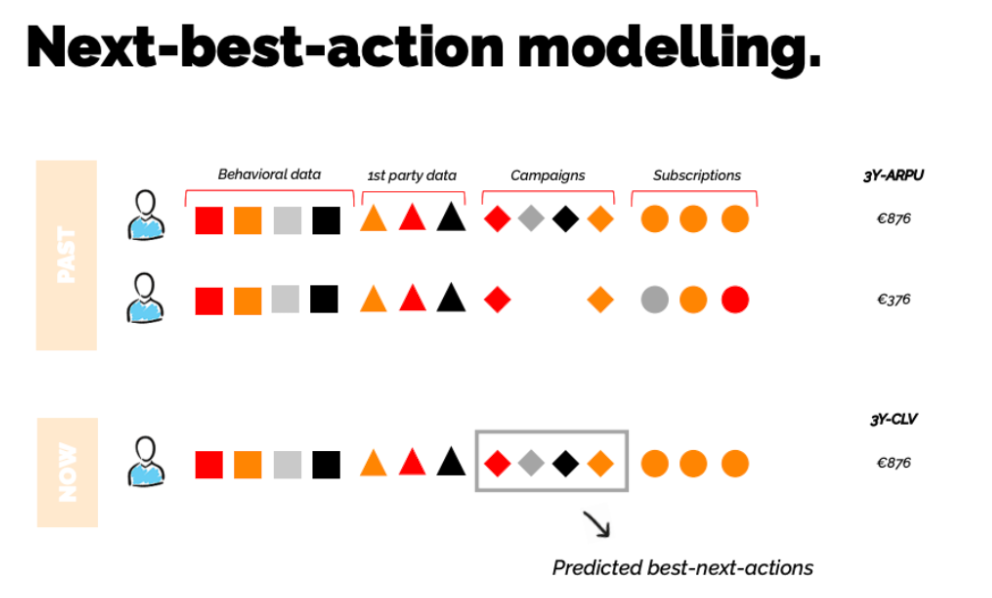
The next-best-action model is a step ahead of the propensity model in that it informs the data team of the action they should take after a user has subscribed, in terms of marketing.
“With this model, you can truly start personalising for different kinds of users. You know which campaigns to show them without the manual effort, because your data model has learned from previous customer journeys and is now prepared to increase the customer lifetime value,” Bulthé said. “It’s also an excellent way of increasing ARPU.”
Results speak for themselves
The churn model helped the team in targeting user groups and marketing their resources at those who were highly likely to churn.
The users who showed a high propensity to churn received marketing phone calls from Mediahuis. This increased retention by 14.17 percent in just three months.
Users with a medium chance of churn were mailed a video of the editor-in-chief highlighting the importance of Mediahuis’ brands. This increased retention by 9 percent.
Work in progress
During the next few months, the Mediahuis data team will further develop the next-best-action model.
The propensity to buy model has been in production since March and the next step is to conduct new dynamic paywalled A/B testings, which, over the course of the next year, will be readied for conversions.